Turning environmental data into actionable, visual intelligence
Make environmental data visible, understandable, and actionable
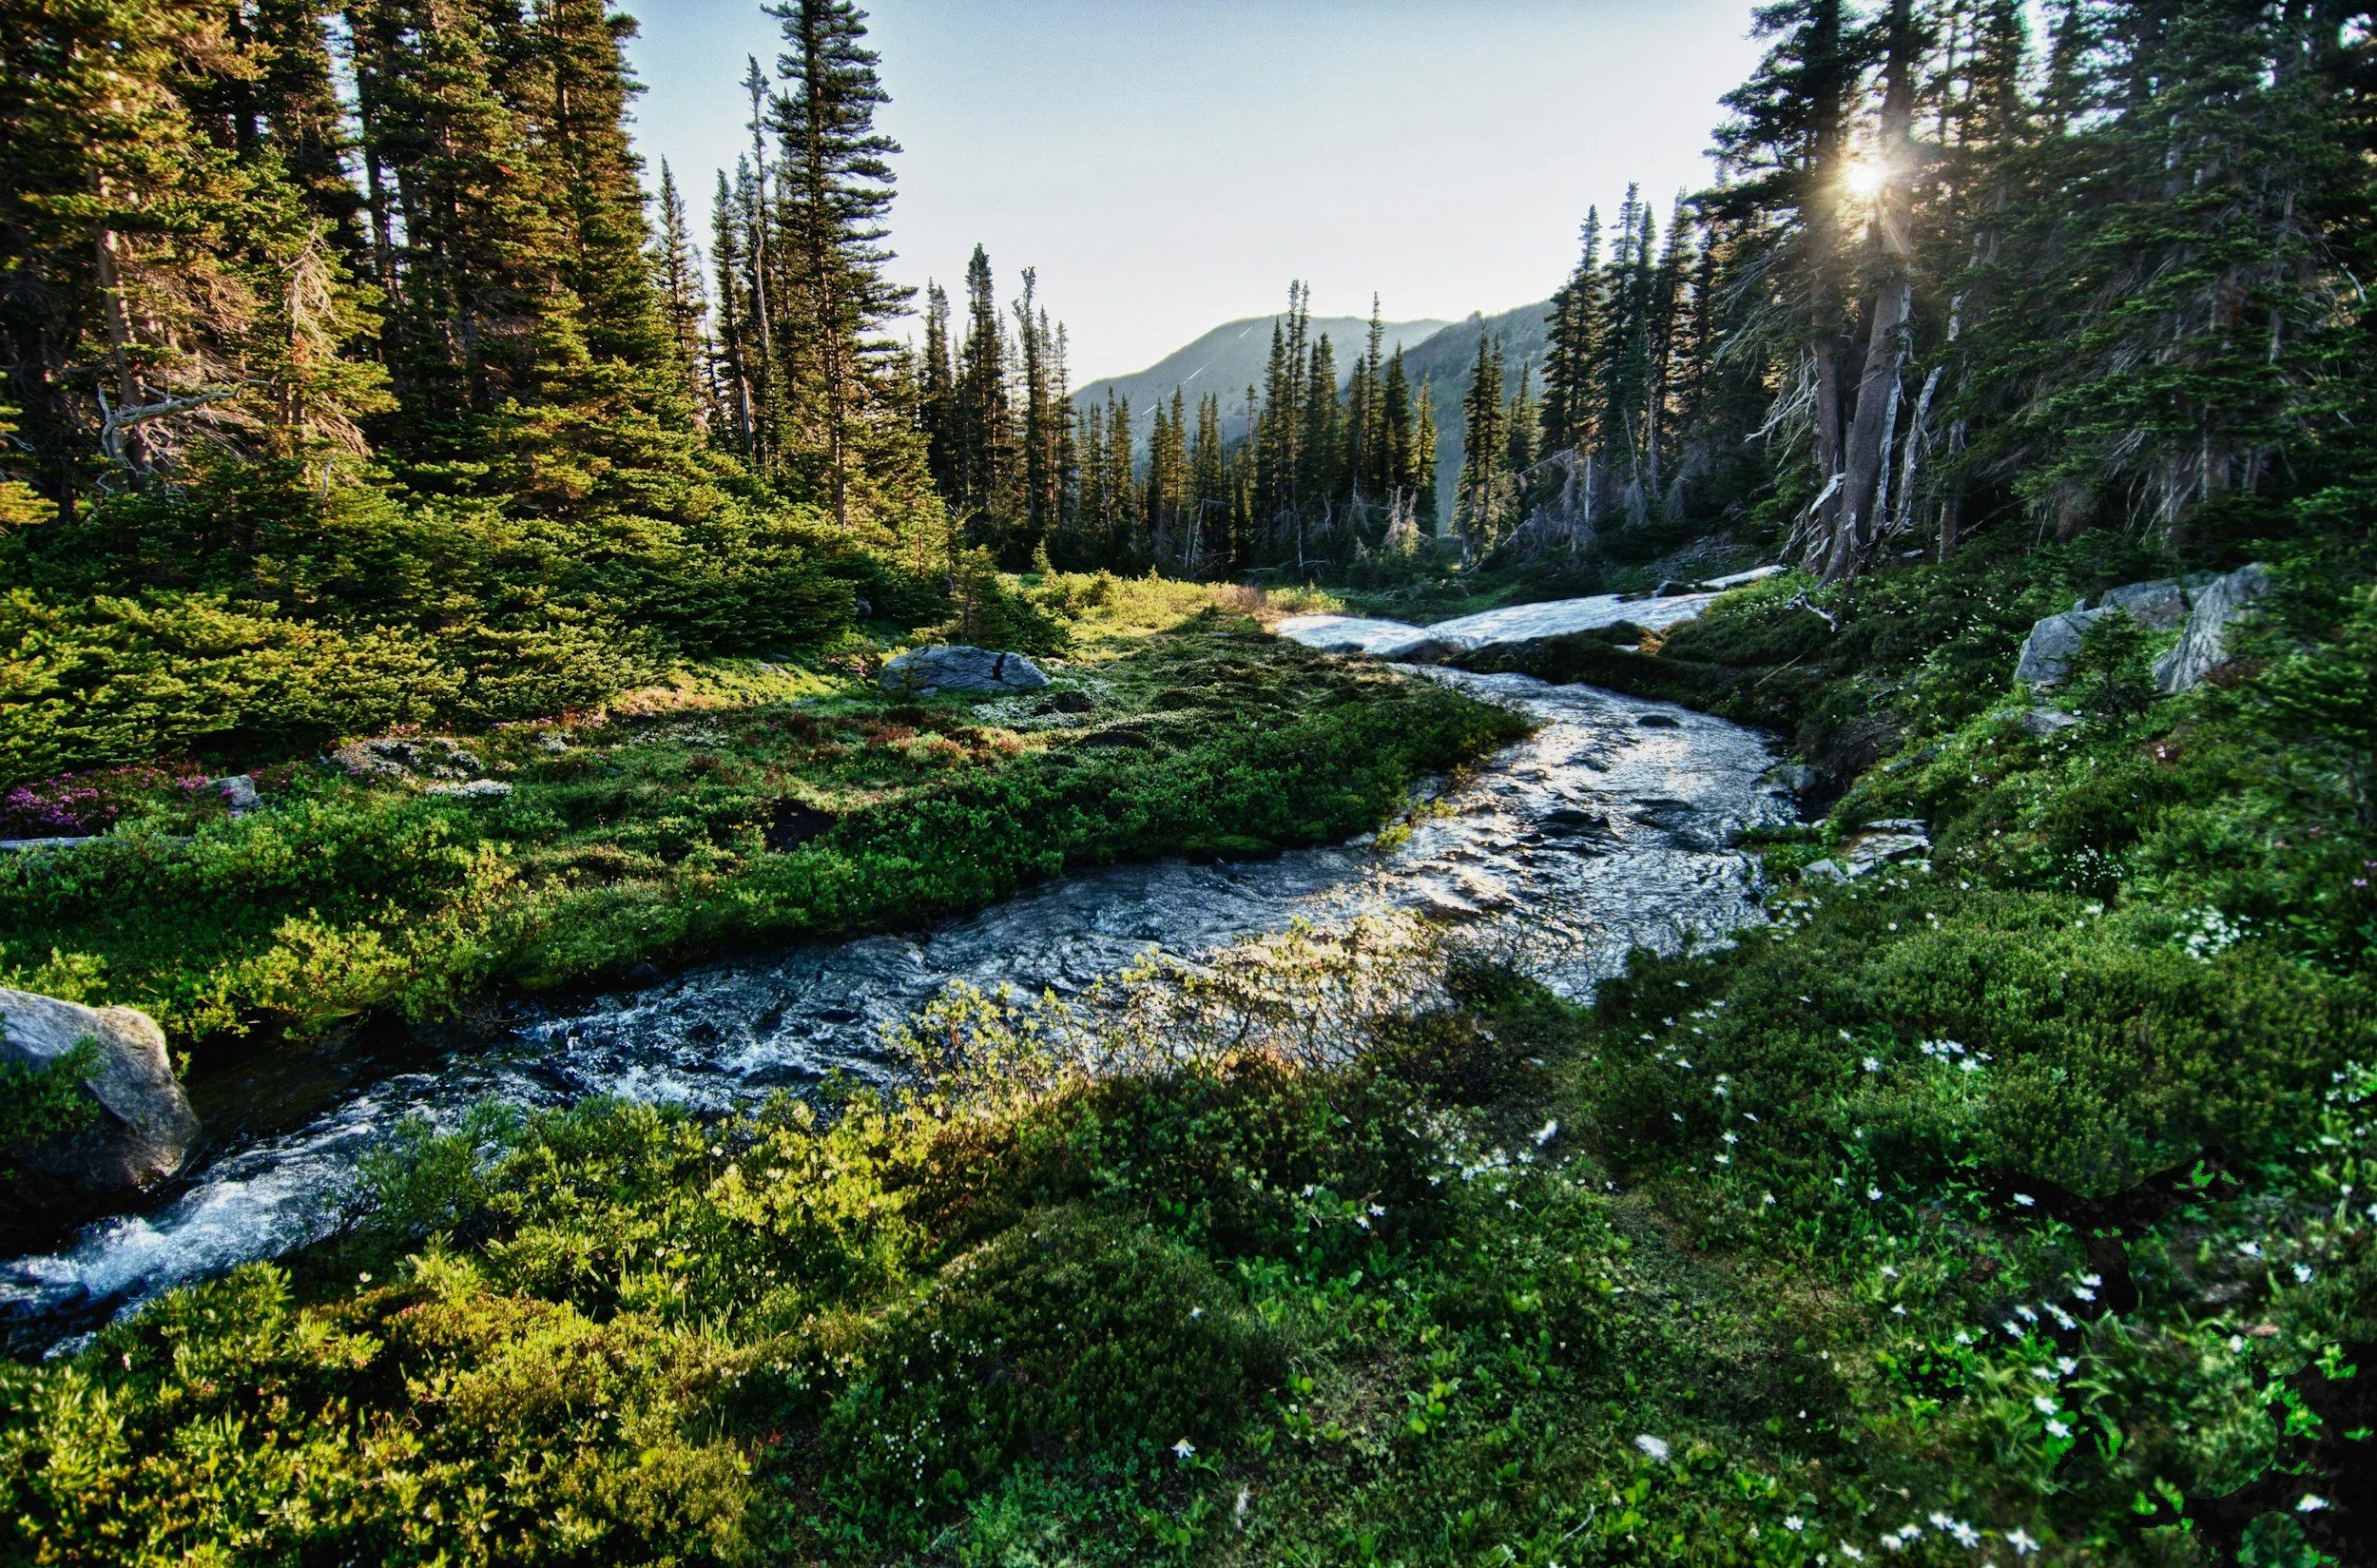
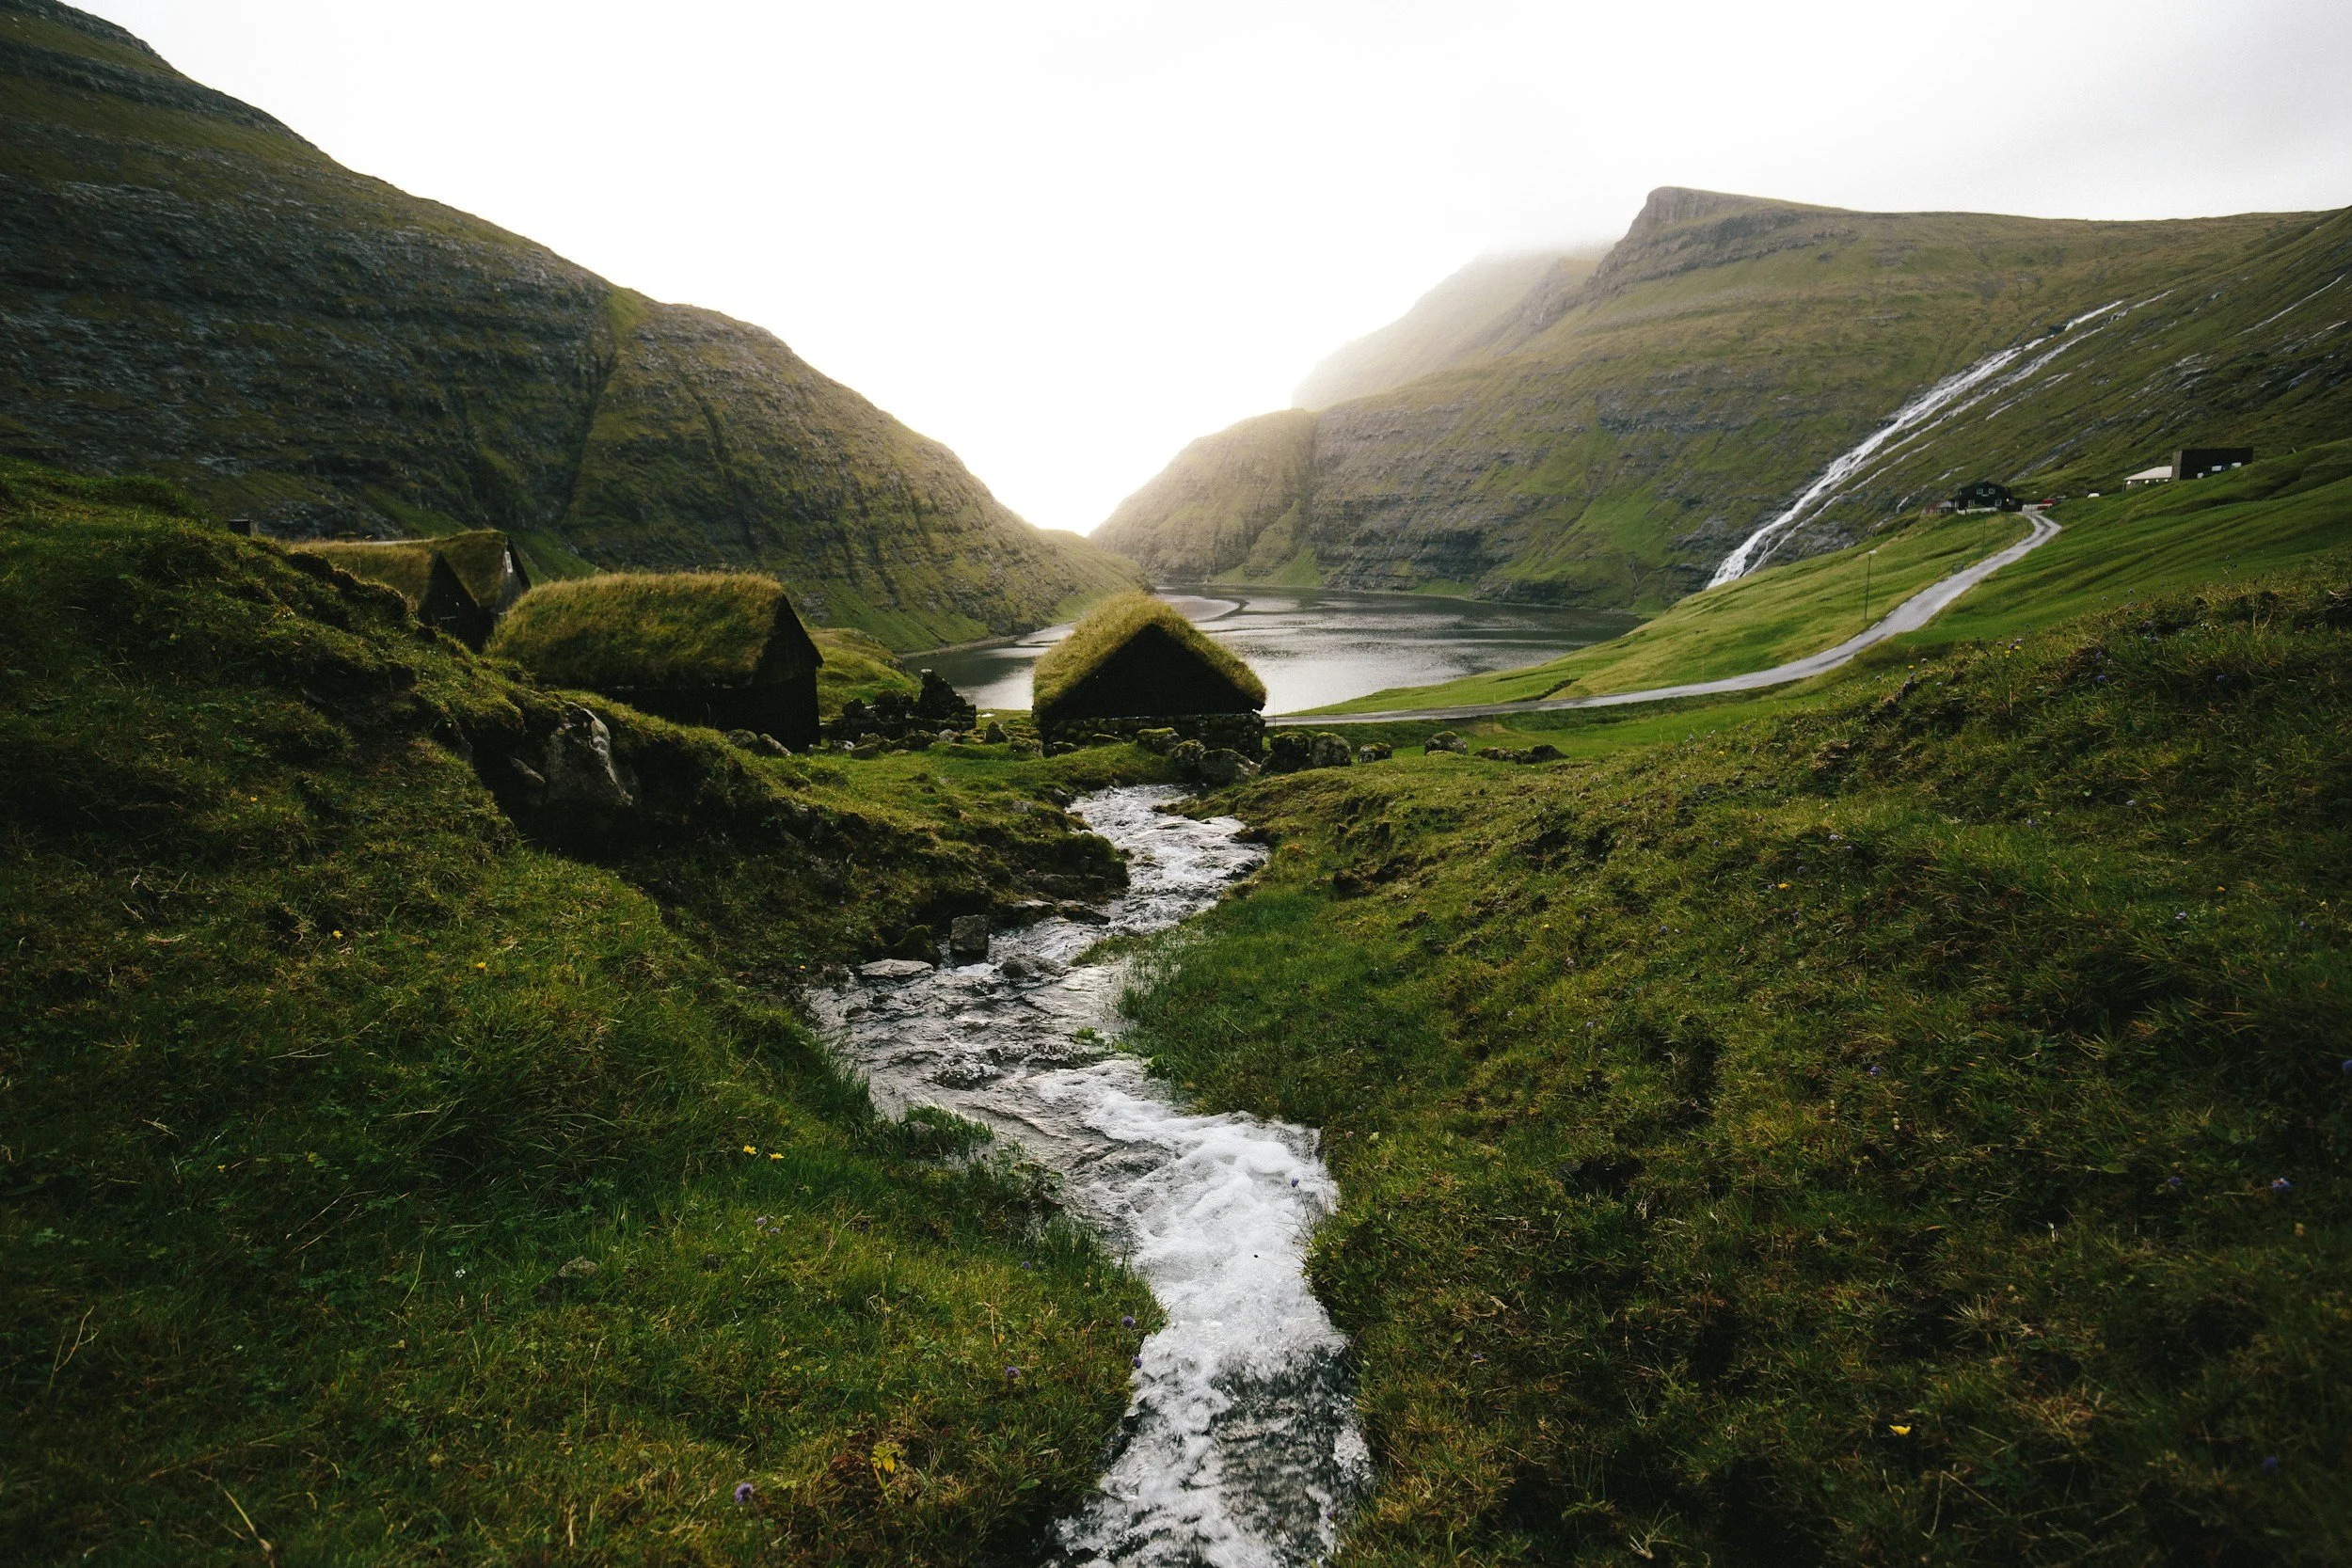
LWNN transforms complex environmental datasets - streamflow, precipitation, temperature, watershed conditions - into clear, engaging video briefings and embeddable visual tools
Who is this for?
LWNN is designed for organizations that depend on environmental awareness to drive impact
Waterway conservation organizations
Recreational and stewardship groups
Climate and wildlife defenders
The Problem
Environmental data is abundant, but not accessible
USGS stream gauges are technical and fragmented
Weather data is difficult to interpret in aggregate
Stakeholders lack timeline, digestible updates
Volunteers and the public are left guessing about conditions
The LWNN Approach
We convert raw environmental data into clear, narrative-driven intelligence
LWNN integrates:
USGS streamflow & gauge data
NWS forecasts and alerts
Hydrological & precipitation models
Location-specific environmental signals
… and turns them into
Daily or real-time video briefings
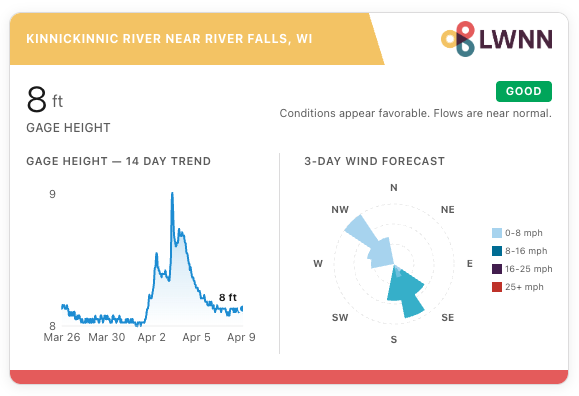
Visual dashboards and embeddable widgets
Condition-based alerts and summaries
Example Use Case: Trout & Salmon Streams
“Is it safe and productive to fish today?” - Answered clearly
Briefings can include:
Current streamflow vs seasonal norms
Recent rainfall and impact
Short-term forecast
Conservation advisories
Outcome:
Protect sensitive ecosystems
Inform responsible fishing behavior
Increase community trust and engagement
Bring your environmental data to life
Whether you’re managing a single watershed or a national conservation act, LWNN helps you communicate more effectively and drive better outcomes.
Capabilities
-
Everybody has weather, but not everyone has meteorologists, or even TV stations. Is your town tired of getting its weather news from a big city hours away? We can partner with you to build and run an online weather station just for your people. You can use it to communicate with your citizens, or sell advertising - your choice!
-
Using the best available information from our partners at Google, we can give you custom data on 70+ air quality indices and toxins
-
Using data from the US Geological Survey, we can provide near realtime information on streams, often including flow rate, depth, and more. Our data is subject to the available sensor readings, but if it exists, we can present it to you.
-
Phase of the moon, upcoming meteor showers, and eclipses are just the beginning. We can let you know when your location might see aurorae, how solar activity might impact radios, and way more.
-
Have your own data that you’d like to include as part of the broadcast? We can integrate it and build displays to help communicate your complex information to your audience. Reach out to let us know what you want, and we’ll find a way.
This video could be yours
The voice in this video is AI, but the data is real - we use information from the National Weather Service, NOAA, NASA, the USGS, and top-tier commercial models to produce our videos.
Every day, we’ll produce a weather report for your location and your readers, with your logo (or the sponsor of your choice). Decide what content you want, create or upload in-line ads, pick and choose your colors. The video is yours, we just help you get there.
Schedule a meeting now
We want to help you increase communication, find new ways to help your people, and help you protect our world.